- Digital Marking System for CBSE
- +91 9229113533
- +91 9229113566
- info@addmengroup.com
- Send Query
- Available as OEM on GeM
Addmen OMR software is a known solution for checking and evaluating OMR answer sheets. This software has unique features due to which requirement of every user is fulfilled. This software also delivers graphical reports, which help the user to analyze the results carefully.
The result obtained after the evaluation of the OMR test sheet is stored in the software, which later can be correlated with the other test reports, to get the overall performance report of candidates in graphical form. Through these graphical reports, the most recent exam given by candidate is compared with the previous test results, so a detailed analysis of the candidate’s performance can be carried out.
Every result can be displayed in form or a text or a pictorial format. Understandings a result using words may take the considerable amount of time. The major advantage of displaying a result in from a pictorial format helps a person to understanding in a very short period of time. The most common way of representing a diagram in Graphical form. There are different types of Graphical form and the commonly used ones are line chart, bar chart and pie chart.
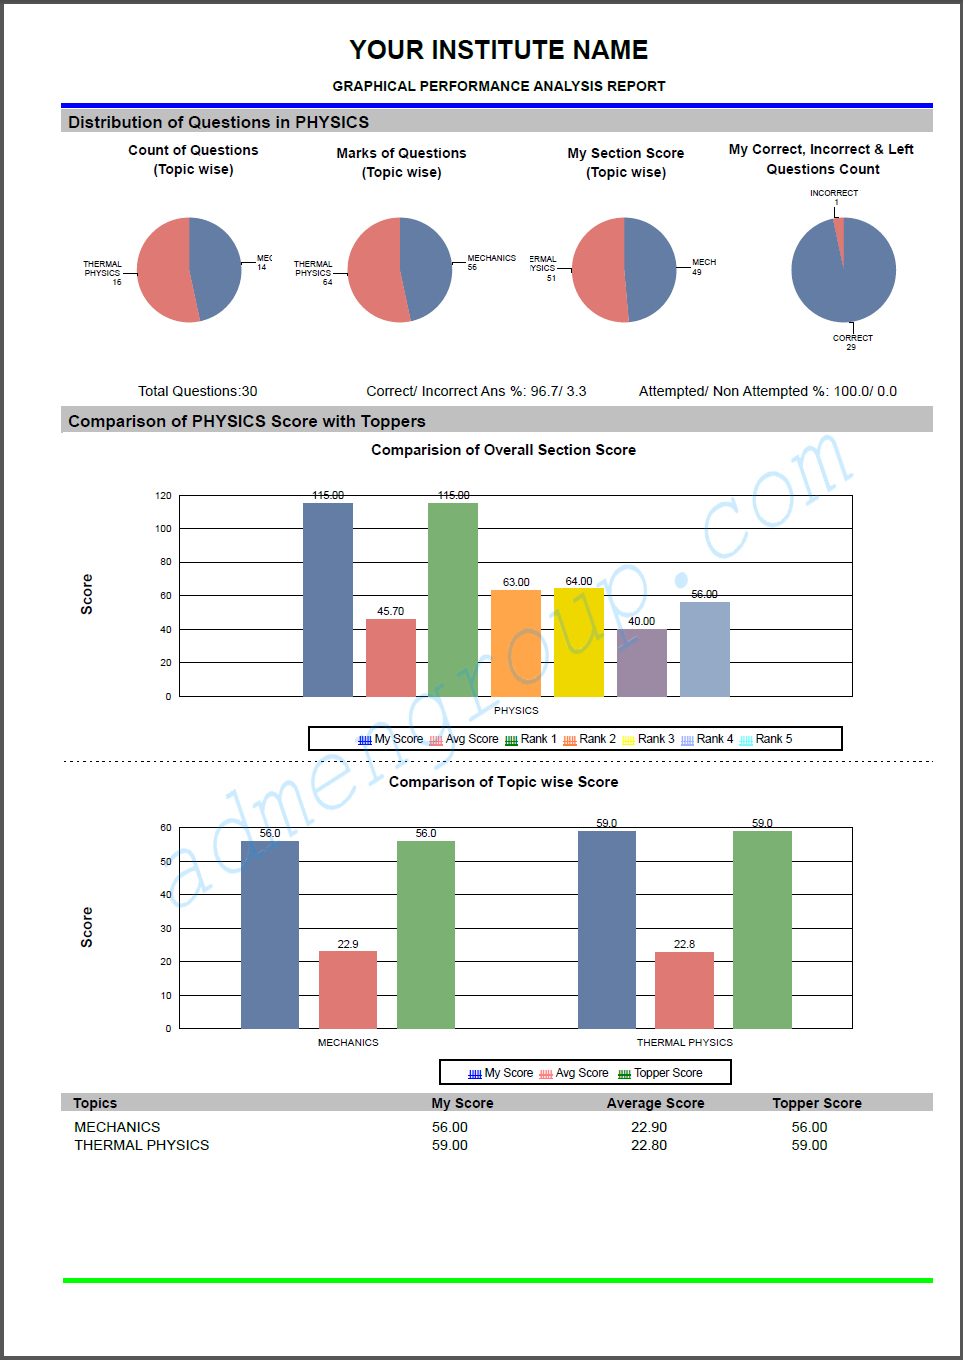
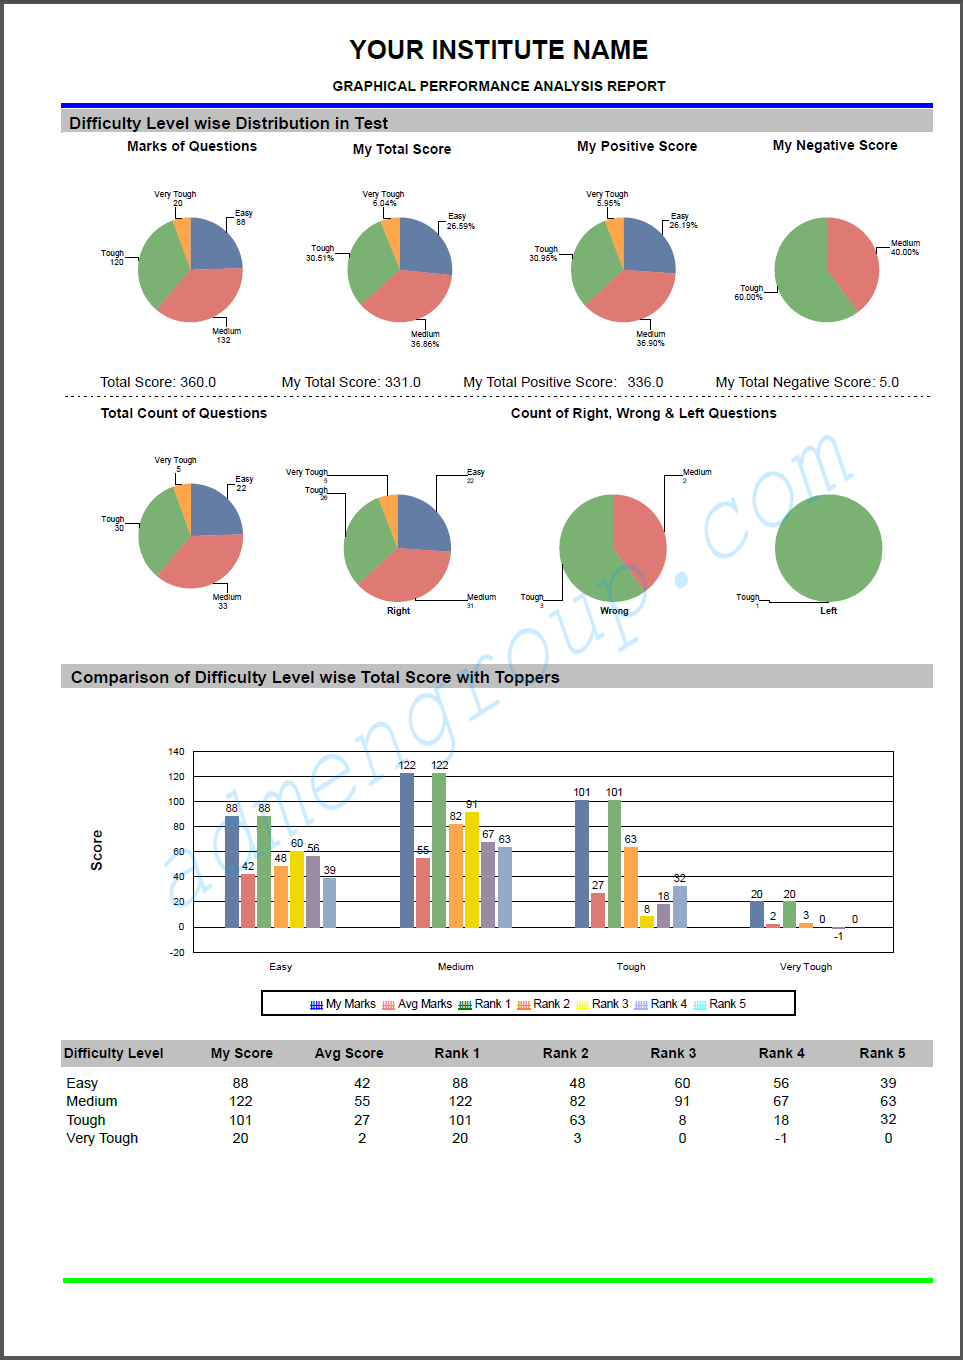
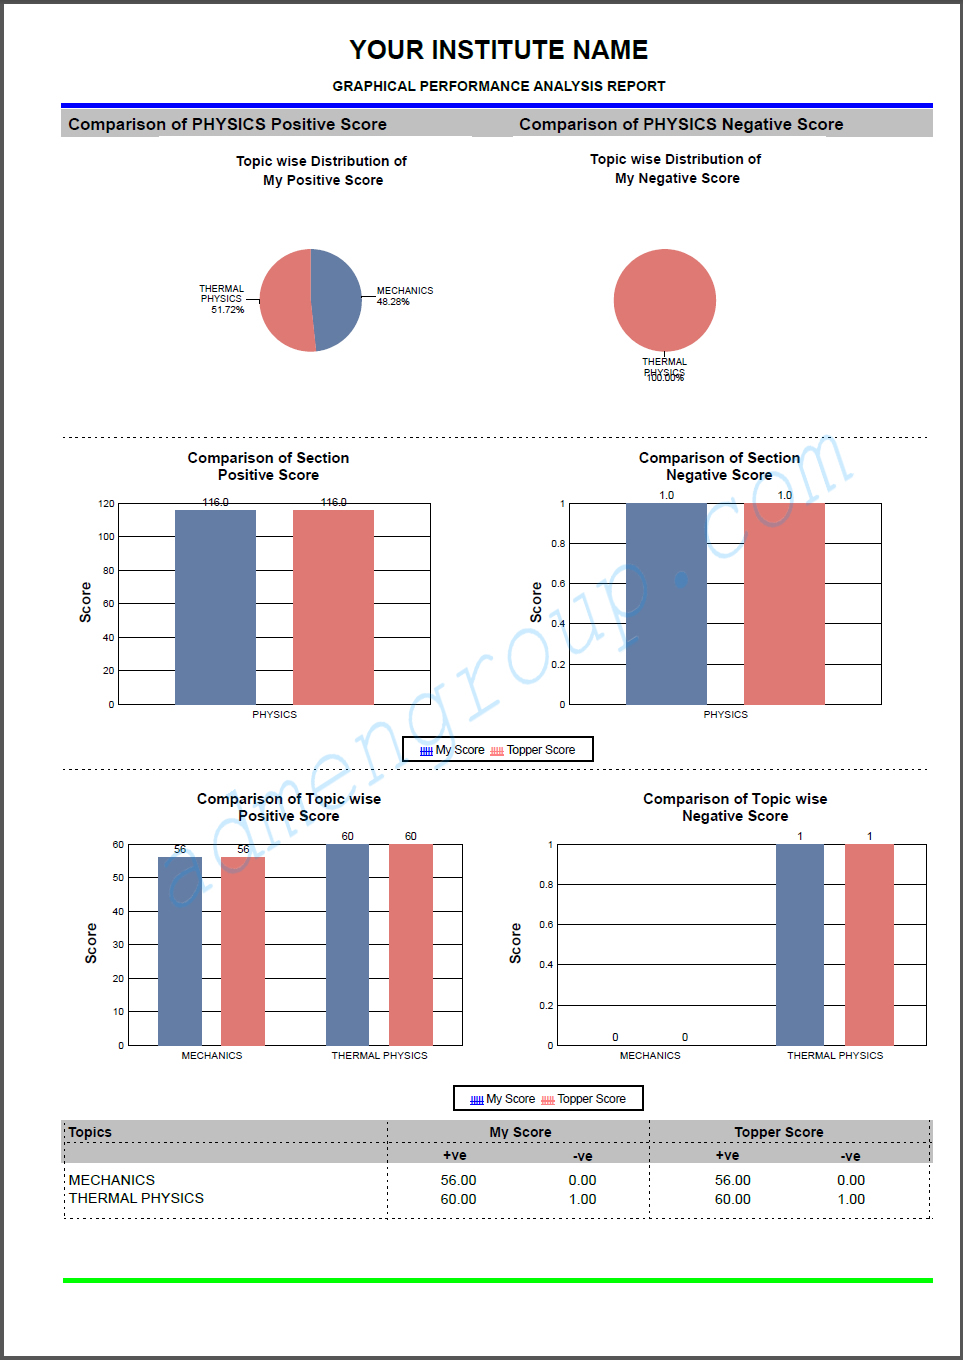
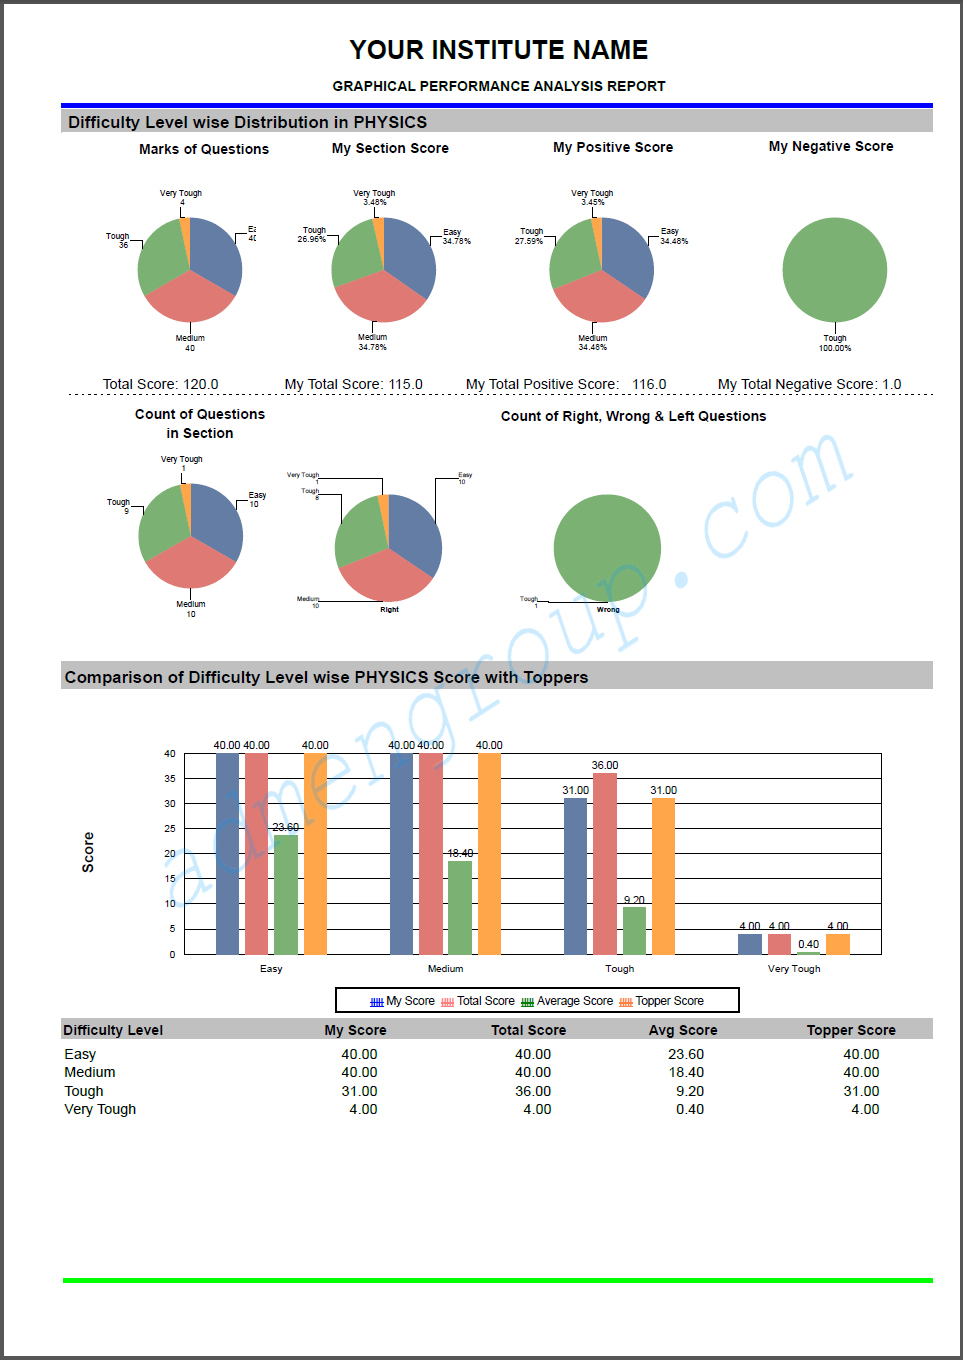
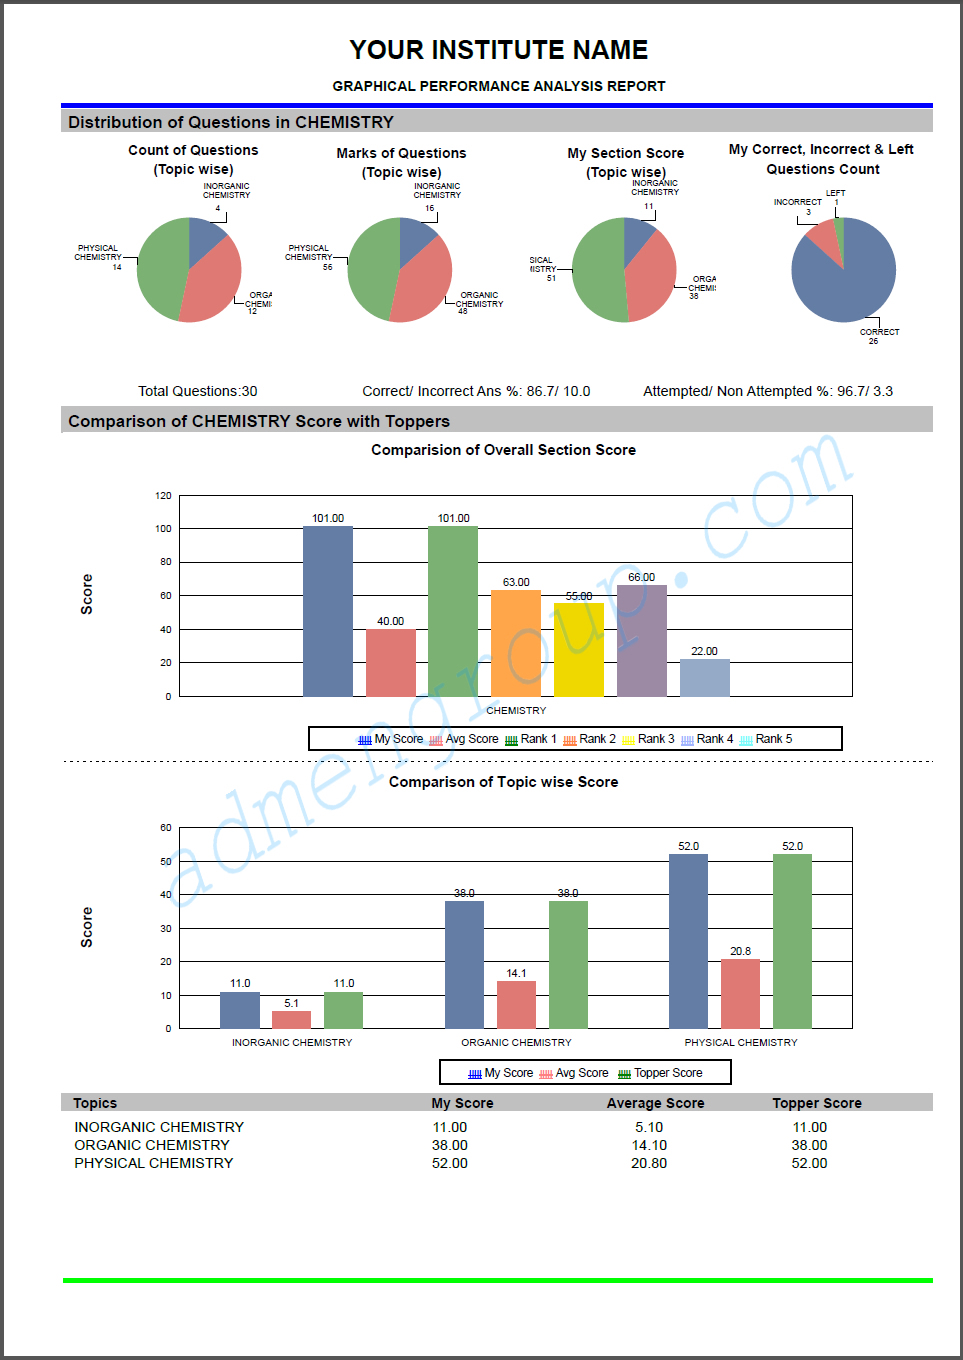
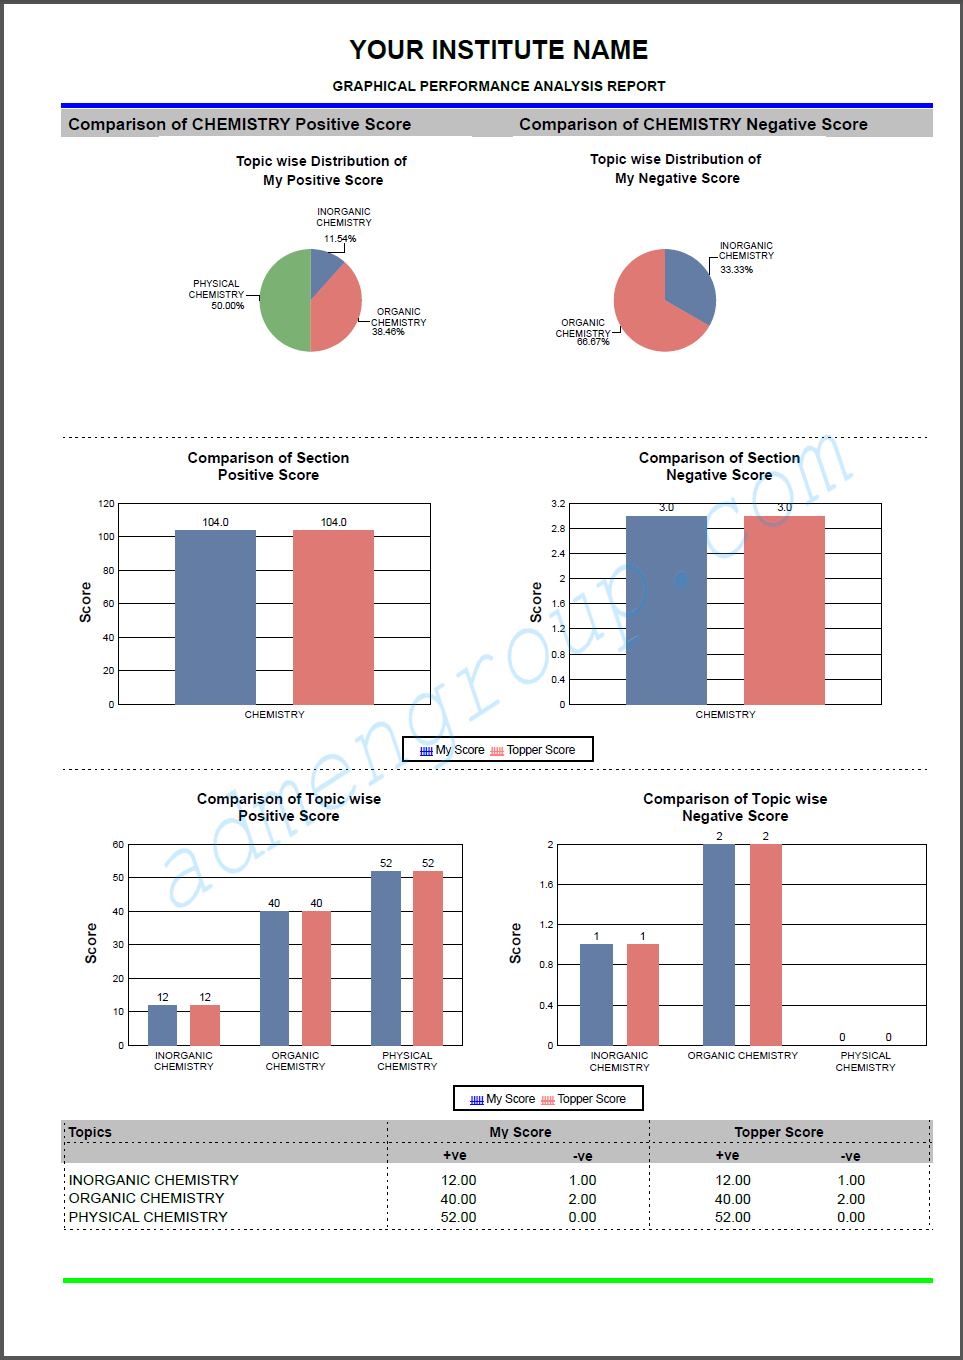
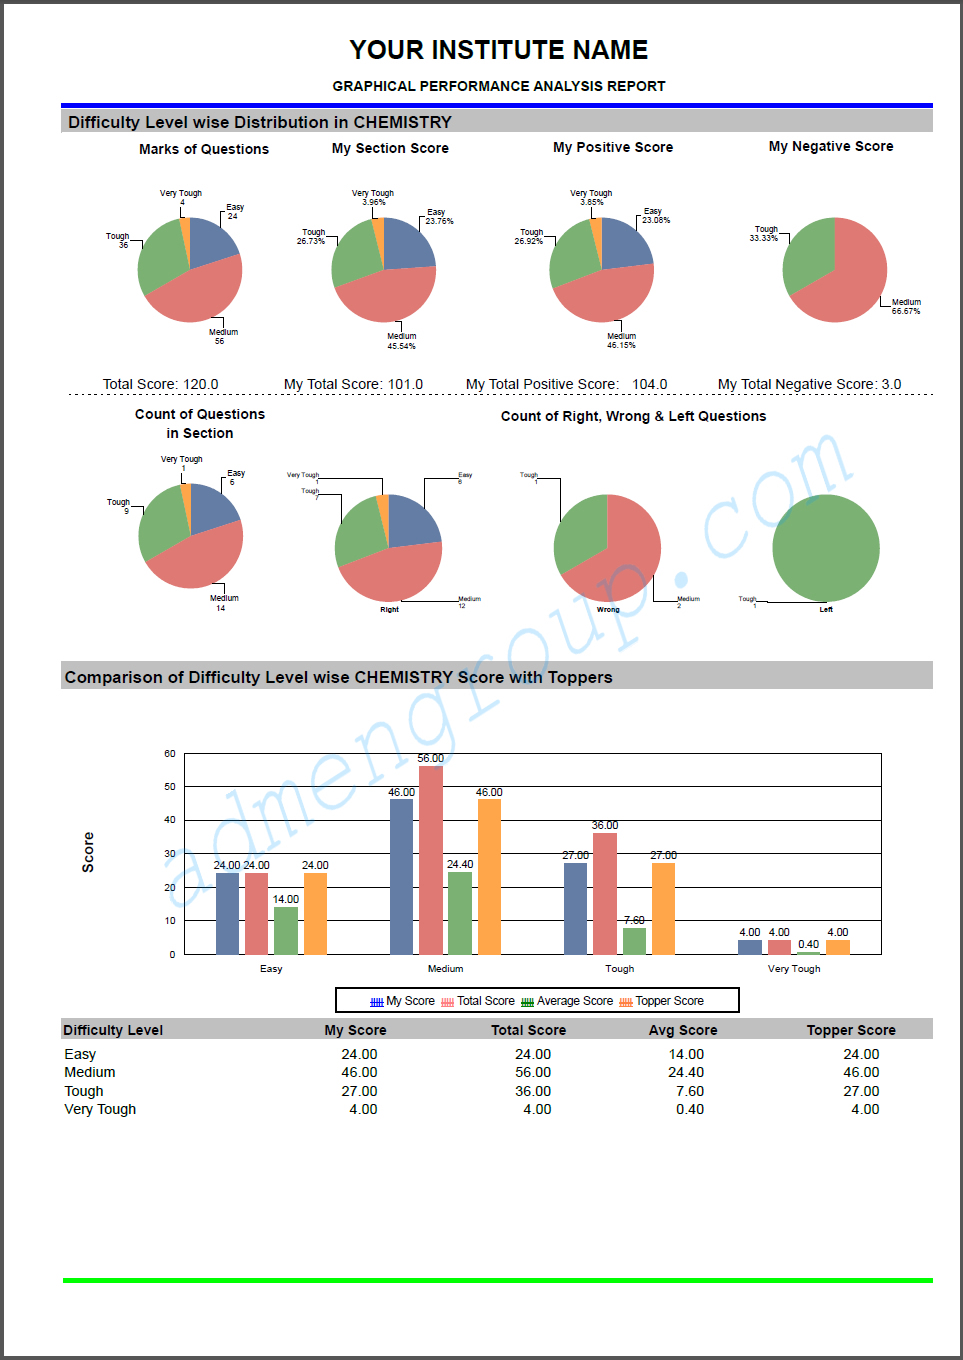
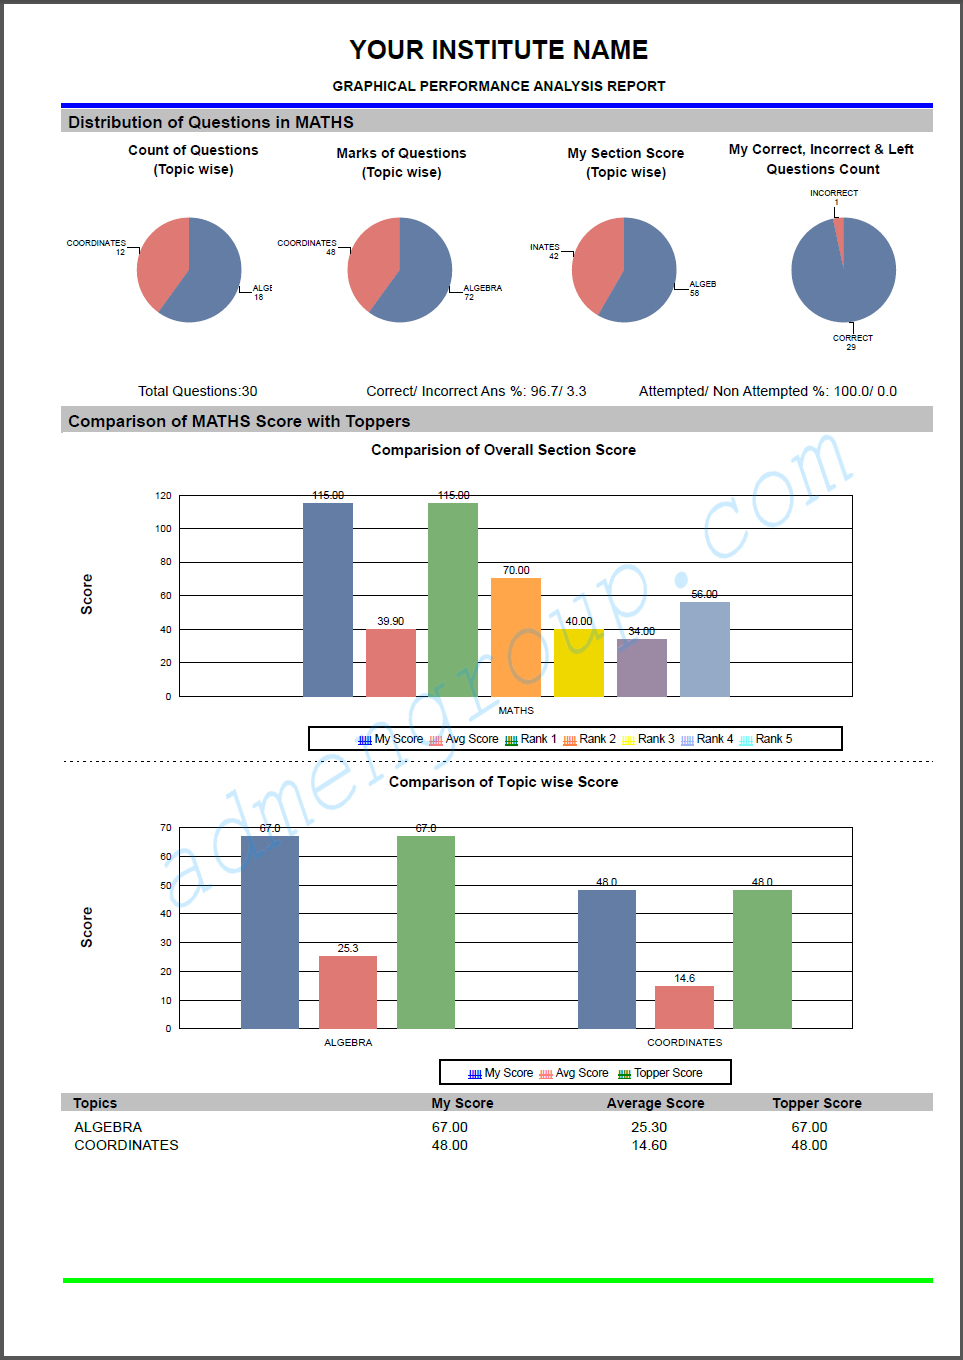
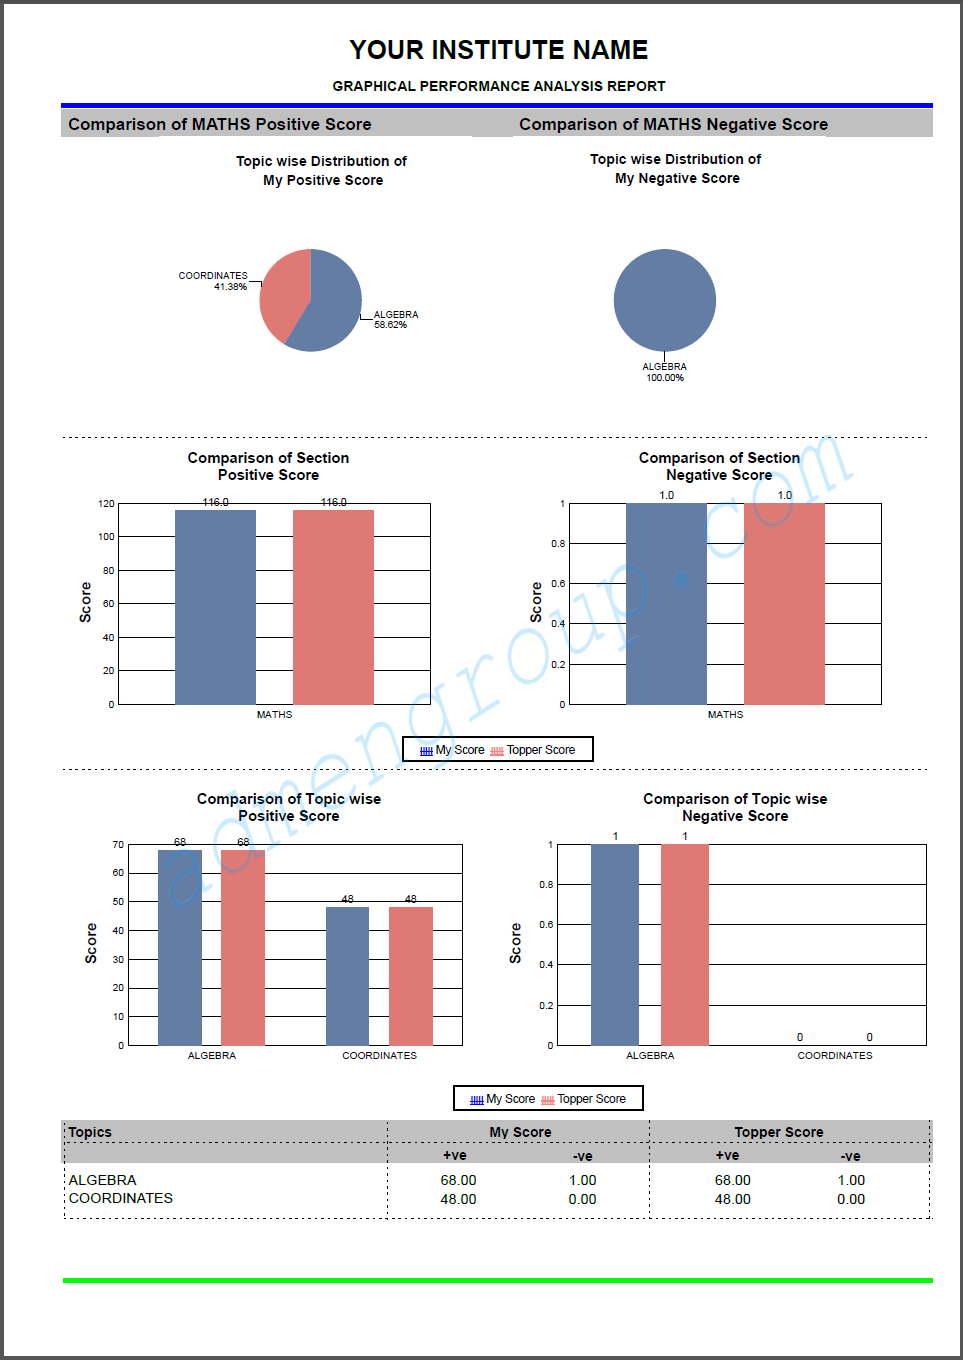
Displaying the test result in form of graphical report description helps to evaluate a candidate's performance in a very effective manner. Graphical reports can be effectively used to compare a student score in past tests conducted, the scores conducted in the appeared test, the scores in each section of the current test, the scores in each section of the test and the score in each difficulty level category of question.
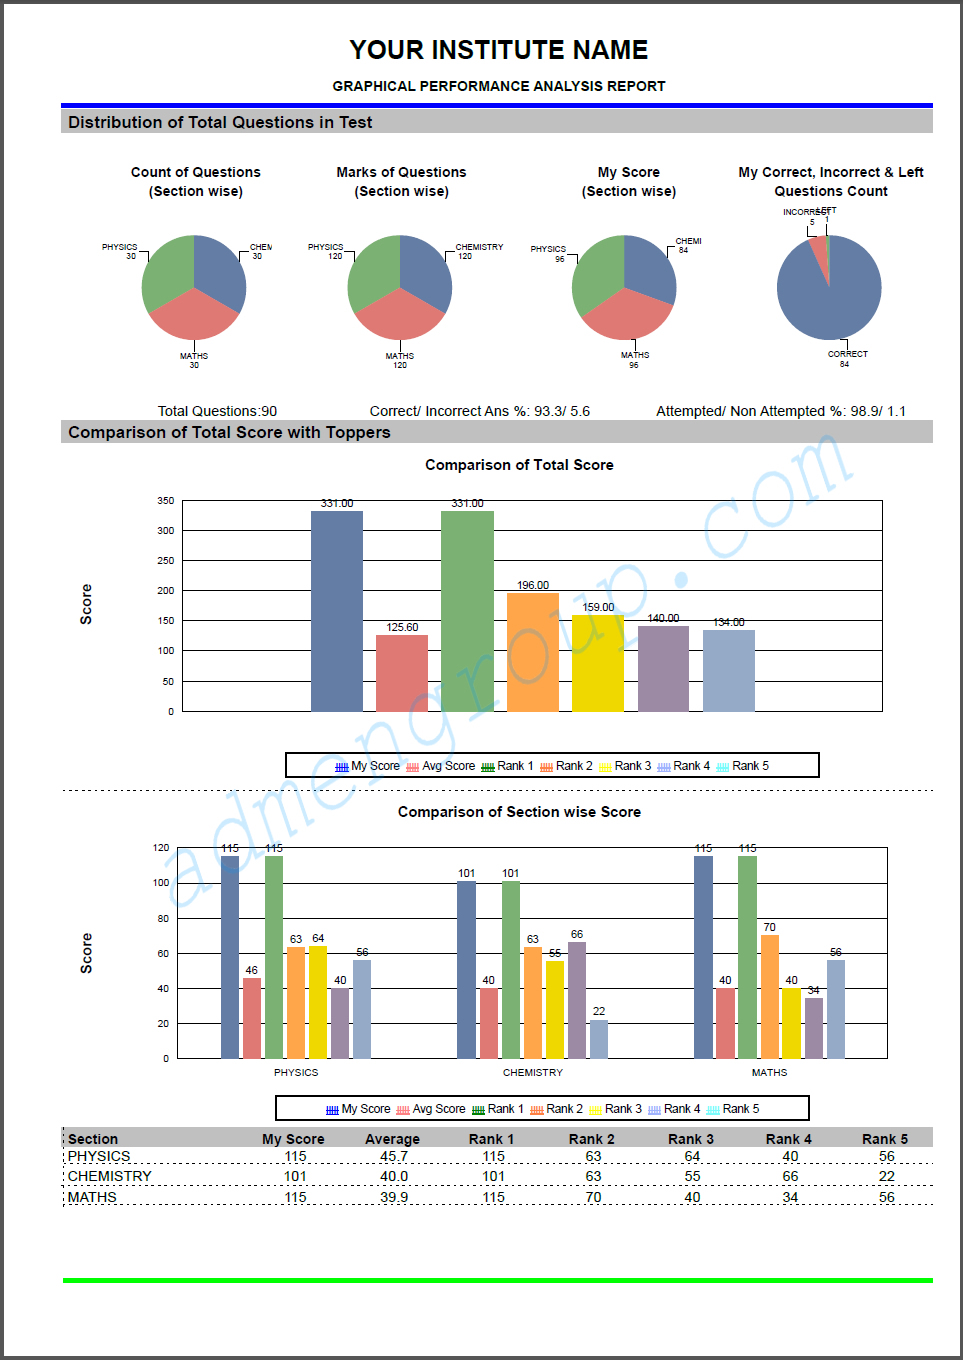
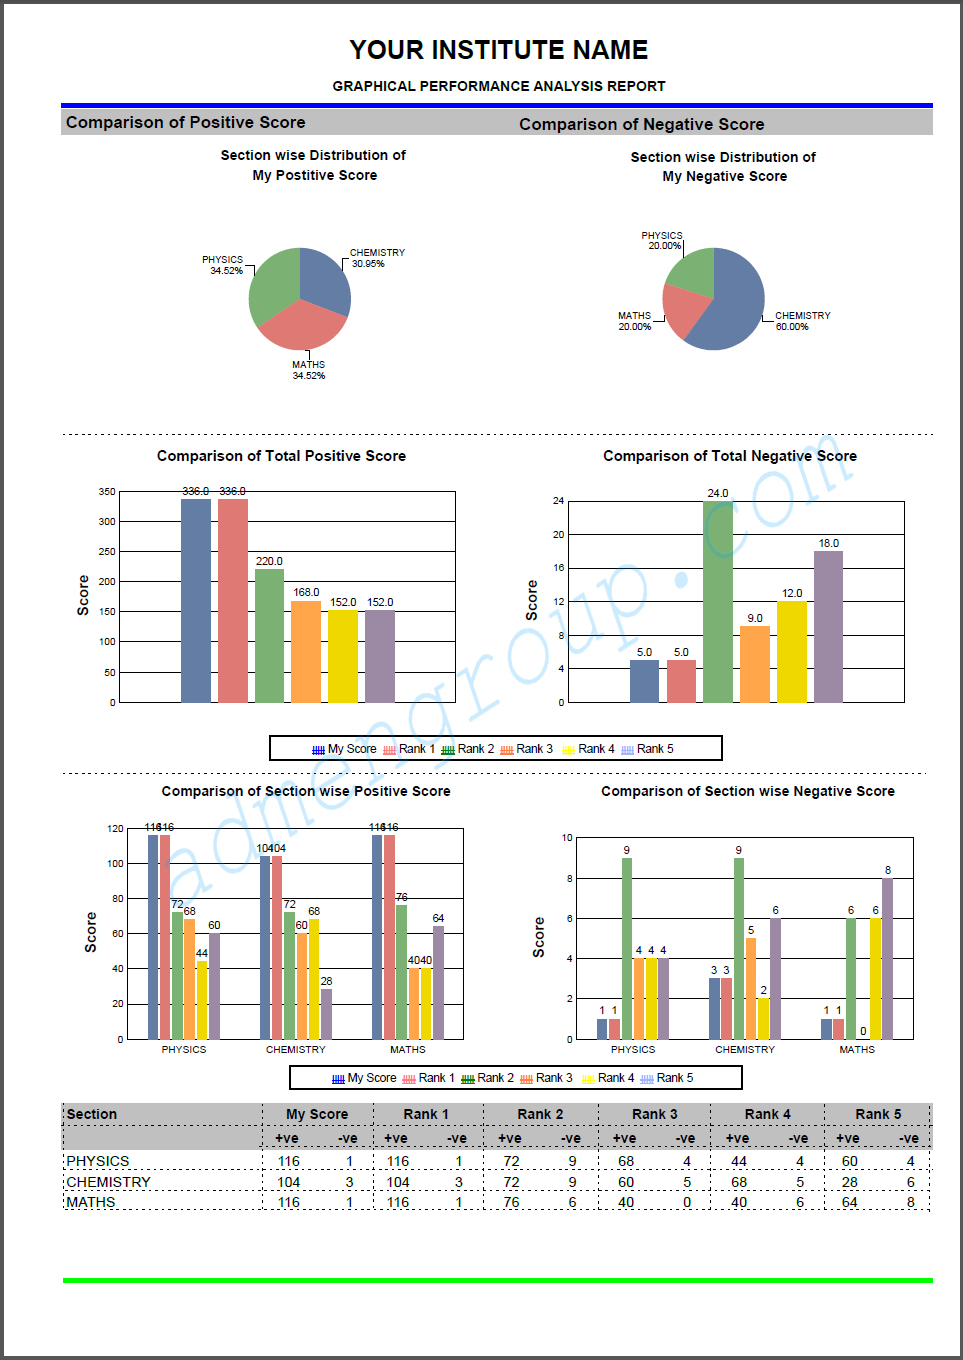
The results obtained at the above-mentioned areas are compared with the candidate's individual performance with the average score, minimum score and the scores of the toppers. The various resulting parameters are compared and plotted in form of a graph.
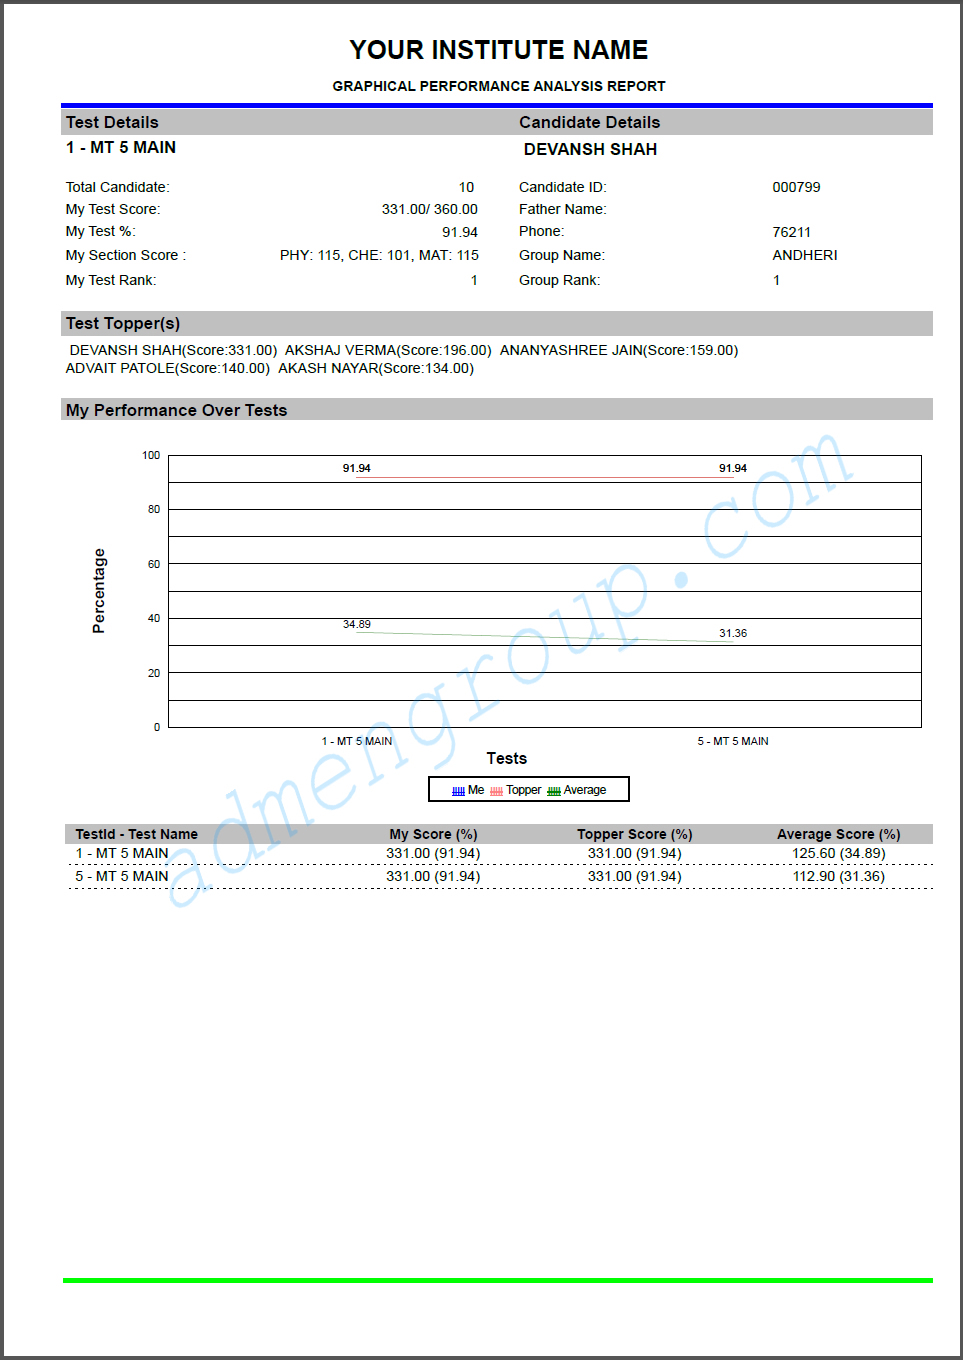
Different type of chart used to indicate the different result. The overall performances of a candidate are done with the help of a line graph chart. This chart is consisted of lines, and it compares with the student past ten results or as required. It will also plot the detail with the average, top scorer, the minimum scorer among all the candidates.
When we need a result that has to plot the distribution of various items in performance, we use a Pie chart. We can plot the difficulty level of questions as easy, hard, average and very difficult with help of the pie chart. The overall section score, individual sectional score and topic vise performance can be easily done with help of the bar chart.
Candidate Details: Roll No, student Name, student's father's Name, candidate ID etc.
Answer Responses: No. of questions attempted, classification of questions as per difficulty level and subject/section-wise responses, answer key to the questions etc.
Parameters for Individual Performance: Rank, score, percentage, percentile etc.
Parameters for Group Performance: Group analysis reports, names and scores of top five performers, minimum score attained, maximum score attained, and the average group score.
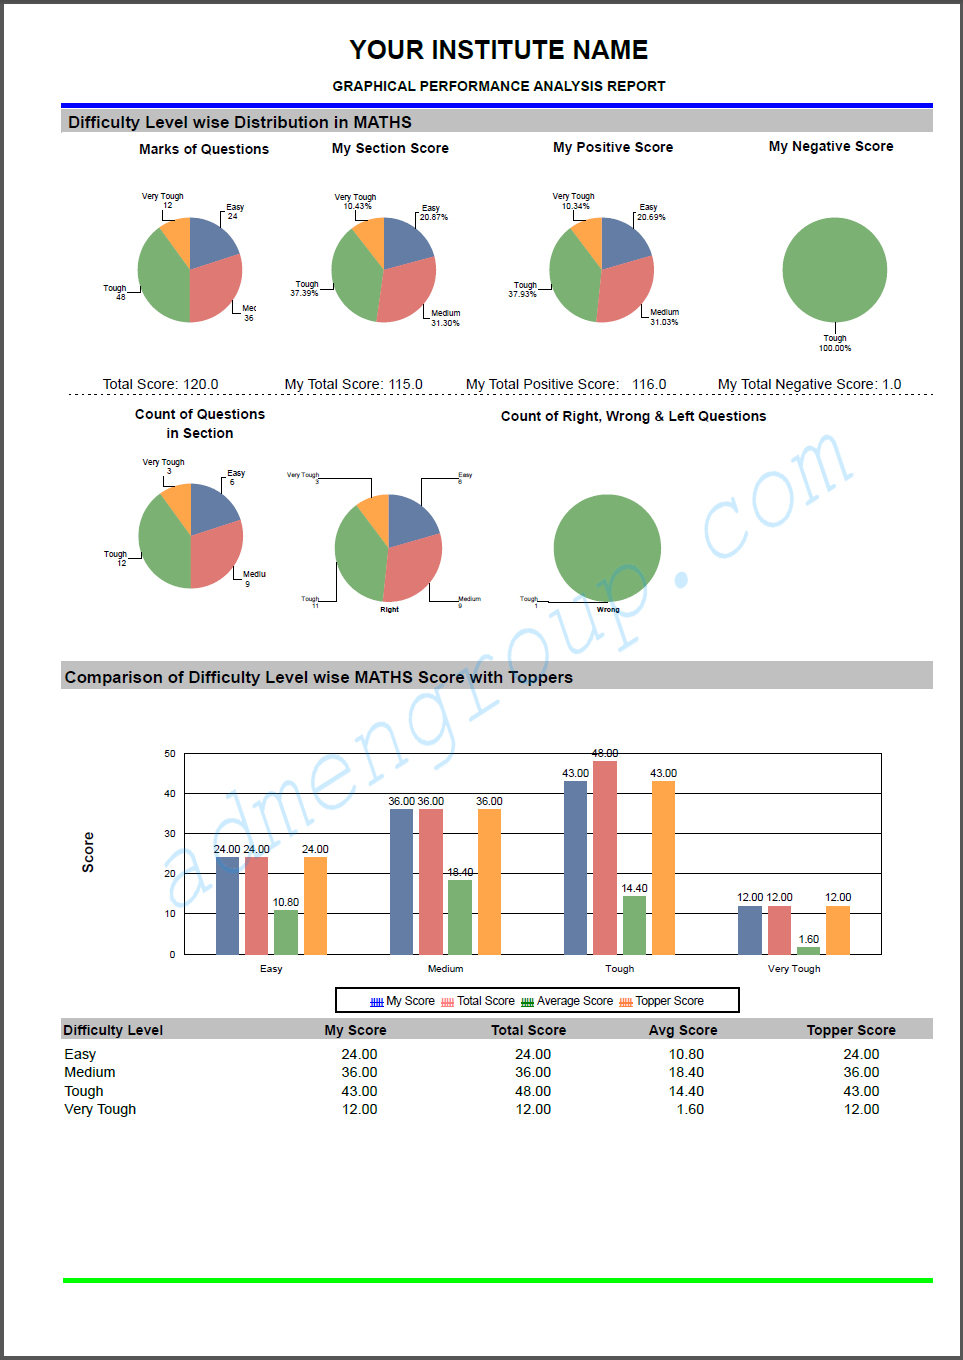
| Download Full Graphical Performance Report PDF |
About OMR Sheets
OMR Design & Print
OMR Sheet Scanning
OMR Reading & Checking
Result & Output